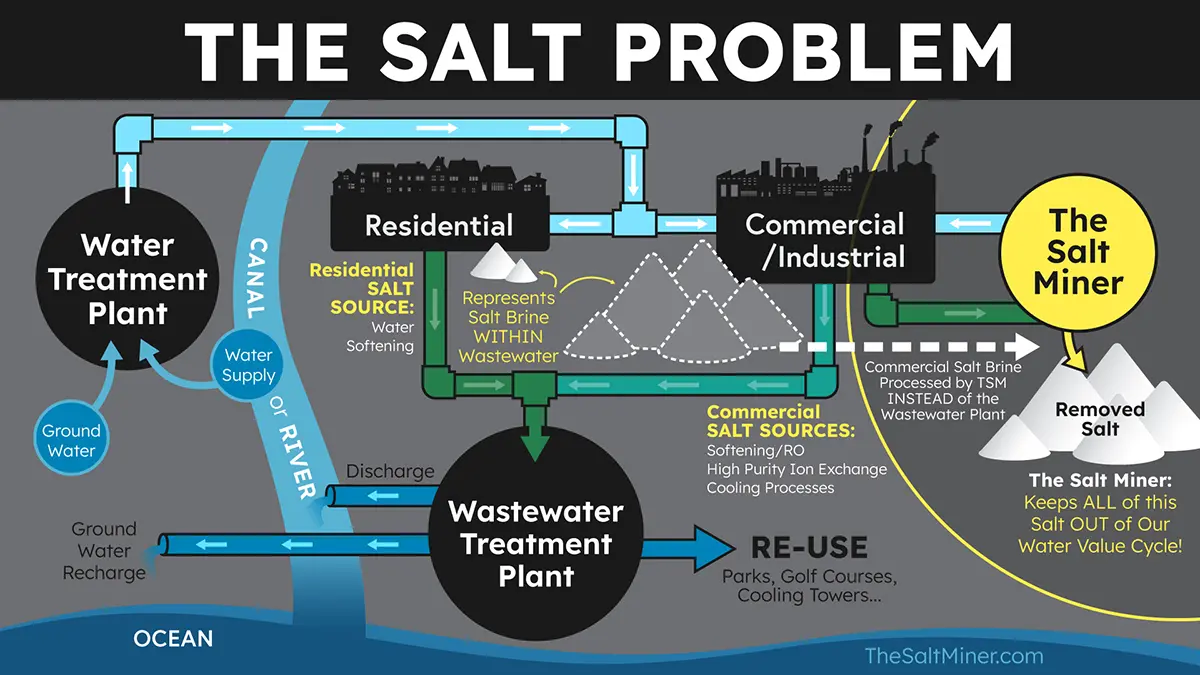
The Salt Problem in Wastewater
The treatment of water to make it useable for industry is adding BILLIONS of pounds of salt into our wastewater.
The Salt Miner would sit between the brine source and drain pipe to prevent this salt from entering the water value cycle.
Sources of Salt Pollution
Human activities, especially water treatment processes, generate significant amounts of salt in concentrated wastewater. All water treatment processes generate waste: a brine (concentrated wastewater), a solid (sludge), and a replaceable “filter”. Brine sources range from water softeners, cooling tower blowdowns, and industrial processes to municipal drinking water and vehicle maintenance. This brine is where the concentration of salt occurs and enters our wastewater system.
These ‘point sources’ can be managed more effectively due to their concentrated nature, unlike ‘non-point sources’ such as road salt.

Brine point sources of salt in wastewater include:
Water Softeners
The largest source in some communities.
Cooling Tower Blowdown
Water used to cool is evaporated leaving behind the “salts” in a brine discharged to wastewater.
Industrial Process Water & Wastewater Treatment
Concentrates from water treatment.
Food Processing
From nut roasting, olive processing, cheese production, canning vegetables, etc, most of these processes produce a salt brine.
Municipal Drinking Water Systems
Concentrate is created from removing Nitrates, Arsenic and other health contaminants.
Vehicle Maintenance
Car washes, washing trucks that salt roads for ice control, etc.
Oil Field Produced Water
And More...
Excessive Discharge from Water Softeners
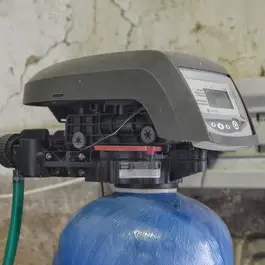
It is estimated that over half of the homes in Las Vegas have softeners and as many as 80% of the homes in Bullhead City and Lake Havasu City. And it is believed that ALL of the casino hotels have softeners. Whereas a residential softener has 1 cubic foot of resin that could discharge 10-15 pounds of salt two or three times a week, some of the bigger casino hotels have hundreds of feet of resin and could discharge tons of salt a day
End-User Services make water more usable because of the benefits of water treatment (softeners, RO, etc.). The flip side is the pollution caused by the concentrated brines they produce.
Hard Water:
A Widespread Challenge & Cycle
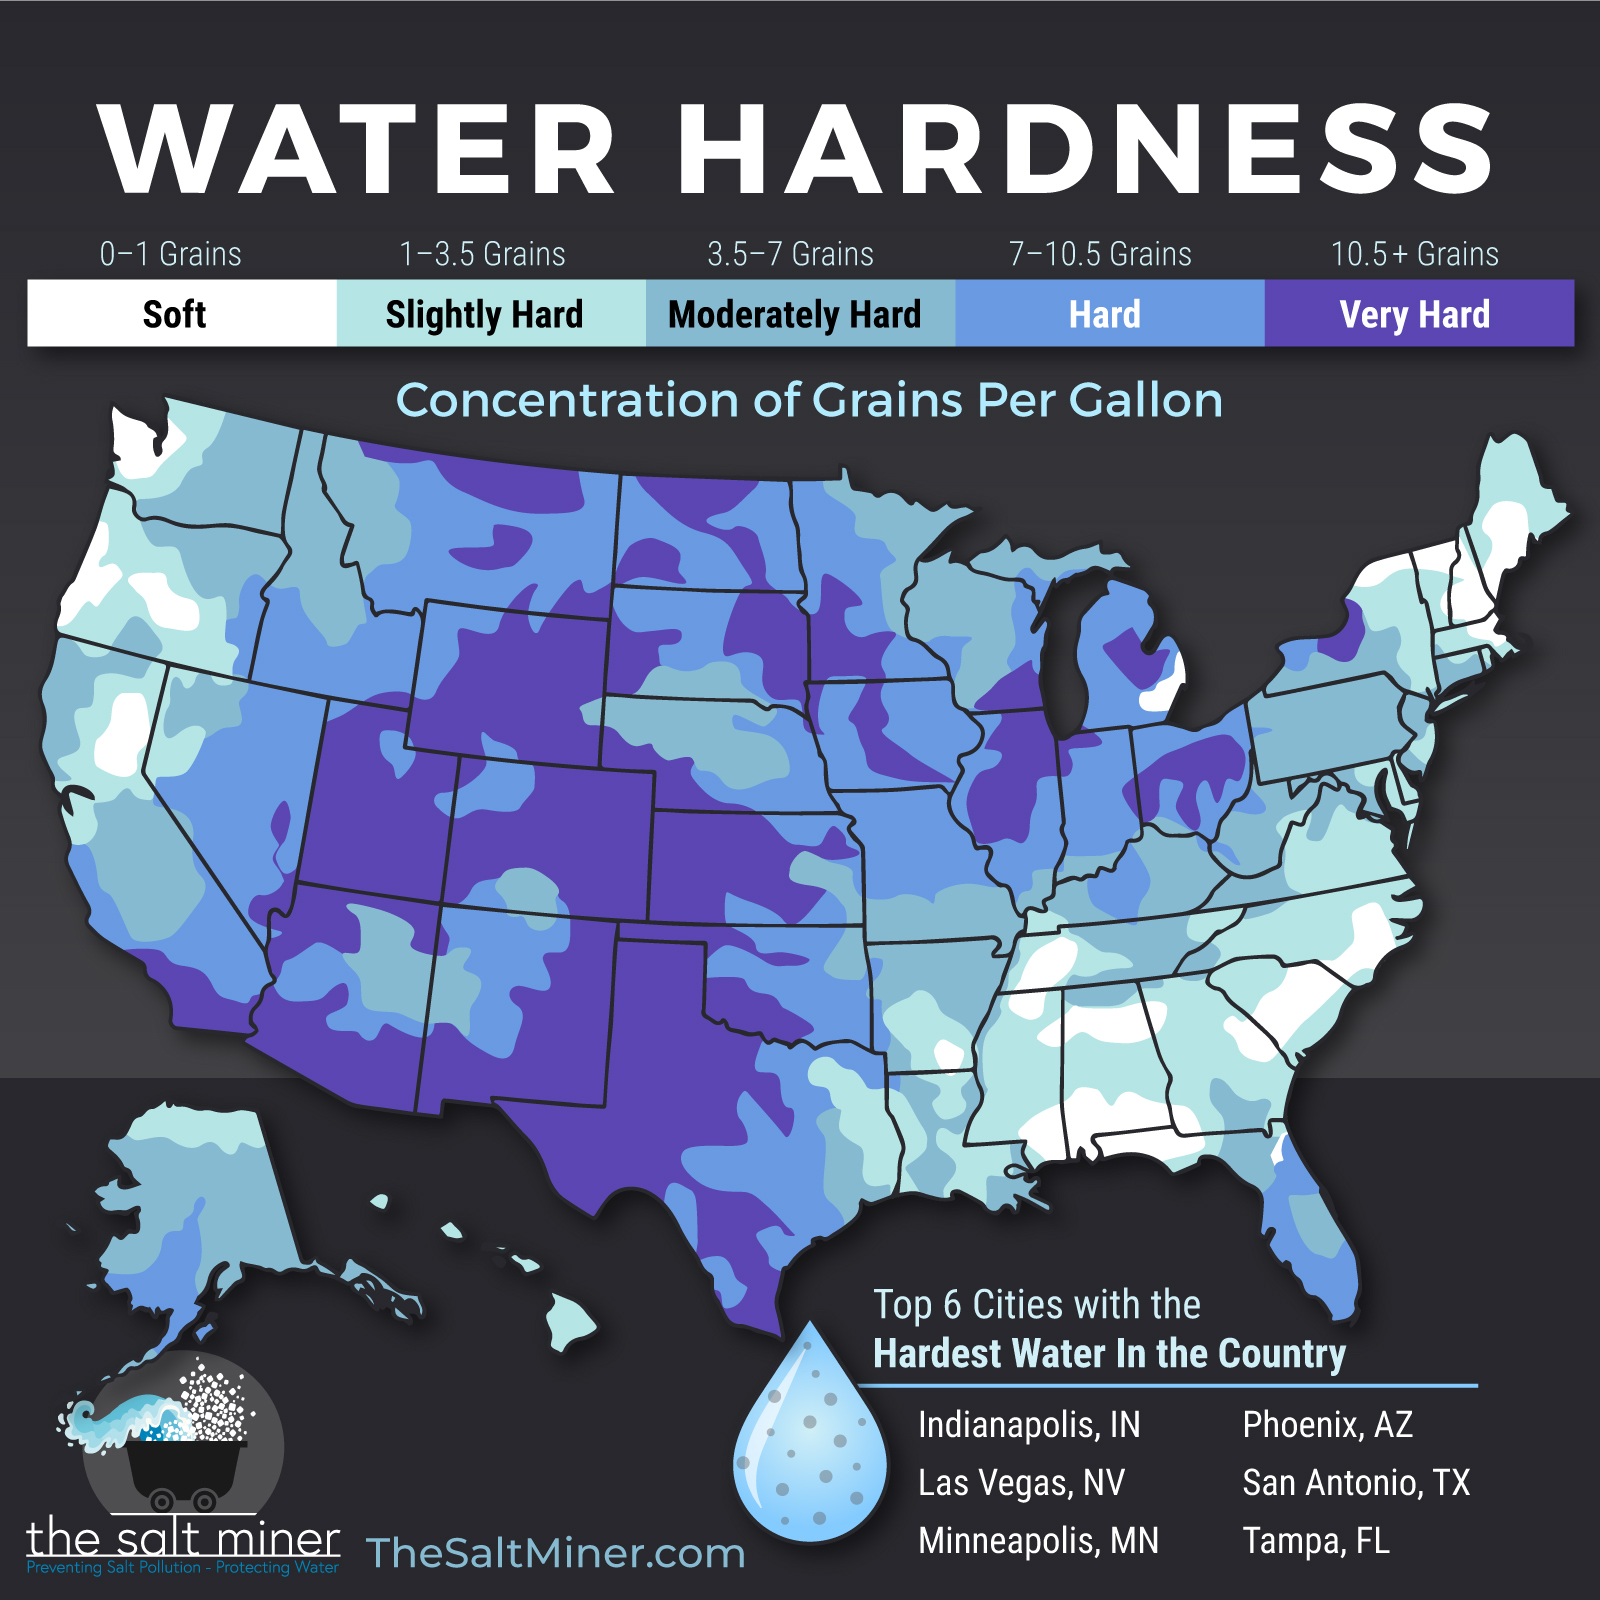
Water hardness, measured in grains per gallon, predominantly indicates dissolved calcium and magnesium. This hardness poses challenges in industrial processes and homes alike. The prevalence of hard water, often softened through the use of water softeners, dramatically increases Total Dissolved Solids (TDS), the salinity gauge of water, after human use up to 3-4 times that of the source water. This spike in salinity adversely impacts water quality, increases wastewater treatment costs, and hampers water recycling efforts.
Our processes for treating hard water are collectively adding to the problem of increasing salinity and in turn relying more on water treatment – resulting in a compounding cycle.
Impact of Salt Pollution
Excessive salt in wastewater poses a multifaceted problem with far-reaching consequences for both the environment and human infrastructure. Salt is vital for various societal applications, but many of these processes are inadvertently contributing more salt to the problem. In wastewater, high salt concentrations pose a challenge to traditional treatment processes.
Salt-laden wastewater increases the burden on treatment plants, raising operational costs and requiring additional resources for effective processing.
This, in turn, can result in the discharge of brine into natural water bodies, negatively impacting aquatic ecosystems and biodiversity, and more.
The High Cost of Salt Pollution
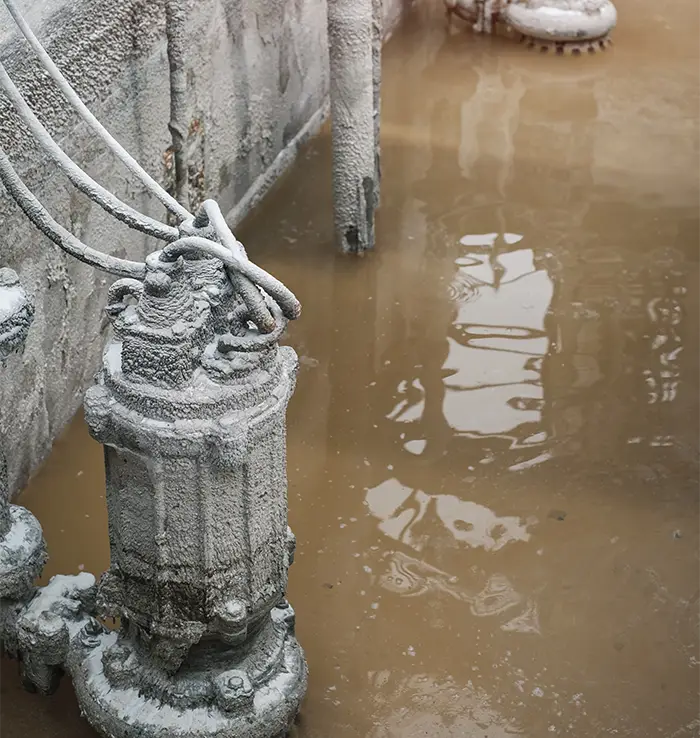
The detrimental effects of salt pollution extend to the environment and utilities, resulting in considerable financial burdens, health problems, and environmental issues.
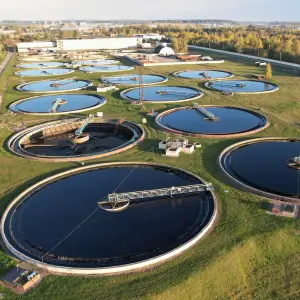
Wastewater Treatment Plant Operating Costs Drastically Increase
- Los Angeles County Sanitation Districts in the early 2000s estimated a cost in excess of $250 million to reduce salts in Santa Clarita.
- Scottsdale, AZ currently estimates $100 million needed to reduce salt at its wastewater plant. The annual operating cost for the plant is $6-8 million. Water softeners are the source of 80% of the salt problem in this area. It would cost approximately $25 million to install The Salt Miner in each home instead.
- Madison, WI says it costs 20 cents to put one pound of salt in water but $5 per pound to remove it from wastewater.
- A noted wastewater treatment engineer has advocated for adding a 17 cent per pound tax on softener salt. This salt costs as little as 10 cents per pound in a bag and less than 5 cents per pound when purchased in bulk.
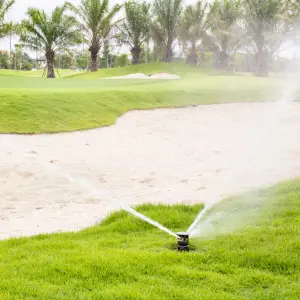
Reclaimed Water Users Have Excess Costs and Issues from Need to Counteract Salt
- Industrial Users Spending Increases to Counteract Salt: Palo Verde Nuclear Generating Station estimates that their cost of using reclaimed water will increase dramatically over the next 30 years as salt levels in the water continue to increase.
- Higher Chemical Use to Counteract Salt Levels: Many cities recycle wastewater directly onto golf courses and other “landscape irrigation”. These businesses are then faced with the need to use more chemicals to counteract salt levels.
- Regulatory Compliance Challenges: Reclaimed water users may encounter difficulties in meeting regulatory standards for water quality when salt pollution is present. Failure to comply with these standards can result in fines and other regulatory consequences.
- Agricultural Reclaimed Water Use: Reclaimed water used for agricultural purposes may lead to reduced crop yields and diminished product quality due to salt-induced stress on plants. This can affect the economic viability of farming operations relying on reclaimed water for irrigation.
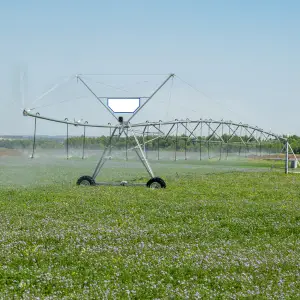
Agriculture & Irrigation Issues with High Salt Levels
- Irrigation Challenges: Elevated salt levels in reclaimed water used for irrigation can negatively impact soil structure and fertility. Excessive salt in irrigation water “burns” the plant, hindering growth and reducing crop yields. Salt from wastewater builds up in the soil ultimately rendering farm fields unproductive.
- Santa Clarita, CA water discharged from the LA Sanitation District’s wastewater plant was used downstream to irrigate high value crops like strawberries. The salt level in the water increased to the point where the ag interests sued the District to reduce the salt levels to meet the Federal discharge standards.
- Colorado River wastewater from Las Vegas, NV and Bullhead City and Lake Havasu City, AZ (and other sewer systems) is discharged back to the River to be used in agricultural irrigation in the Imperial Valley. The salt level in the CO River increases 38% from the Grand Canyon to below Hoover Dam – this is the area where the Las Vegas valley discharges its sewerage effluent into the river. An additional increase is seen between Hoover Dam and Parker Dam – the area where Bullhead City and Lake Havasu City discharge their sewerage effluent. As a result of these salt levels an estimated 15% of the river water used in the Imperial Valley is used to leach the salts out of the root zone to maintain healthy growing conditions. That is approximately the volume of water the Metropolitan Water District is entitled to from the River.
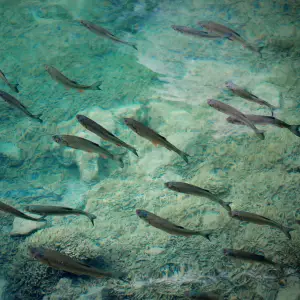
Environmental Effects from Salt Pollution
- Aquatic Ecosystem Impact: Excessive salt from industrial processes finds its way into rivers, lakes, and other water bodies. High salt concentrations can disrupt the balance of aquatic ecosystems, negatively impacting fish, invertebrates, and other aquatic organisms.
-
Soil Degradation: Salt pollution can lead to soil degradation by altering its structure and reducing fertility. High salt levels inhibit plant growth, affecting crops and natural vegetation. This can result in decreased biodiversity and increased vulnerability to erosion.
-
Impact on Vegetation: Salt pollution poses a threat to plant life as it interferes with water uptake and nutrient absorption. This is particularly problematic for plants in areas where brackish water infiltrates into freshwater ecosystems, leading to the decline of sensitive plant species.
- Impact on Wildlife: Terrestrial wildlife may be directly affected by salt pollution when they consume contaminated food or water sources. Additionally, the alteration of freshwater habitats can disrupt the food chain, affecting various species dependent on these ecosystems.

Human Health Effected by Salt Contamination
- Drinking Water Contamination: Elevated salt levels in surface water and groundwater due to pollution can infiltrate drinking water supplies. Consuming water with high salt content can have adverse health effects, particularly for individuals with certain health conditions such as hypertension.
- Human Health Concerns: While the primary focus is often on environmental impacts, salt pollution can have indirect effects on human health. Contaminated drinking water, reduced agricultural productivity, and the impact on fisheries can all contribute to food and water scarcity, affecting communities dependent on these resources.
Other Economic and Infrastructure Costs
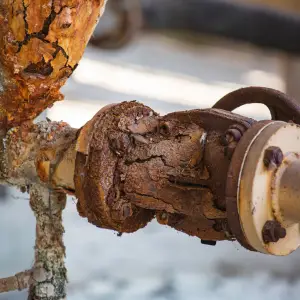
- Corrosion and Infrastructure Damage: Salt pollution accelerates the corrosion of infrastructure such as bridges, buildings, and pipes. This not only increases maintenance costs but also poses safety risks as structural integrity may be compromised.
- Economic Costs: The economic costs associated with salt pollution are substantial, encompassing infrastructure repair, healthcare expenses, and the decline of industries dependent on affected ecosystems. These costs underscore the importance of mitigating salt pollution for both environmental and economic sustainability.
